
Francis Muthoni talks to Radio IITA about the value of applying GIS tools in agricultural research
Sustainable intensification (SI) technological options are suited for specific biophysical and socio-economic contexts, and therefore, knowledge on the spatial distribution of optimal conditions for scaling technological options beyond the trial sites is needed to guide out-scaling. Geographic information systems (GIS) tools generate recommendations domains for SI technological packages by mapping zones with relatively similar biophysical and socio-economic contexts to establish the regional relevance of Africa RISING technologies. They capture and create a great range of data on the earth’s physical and socio-economic attributes. The system is applied for science and other kinds of descriptive information.
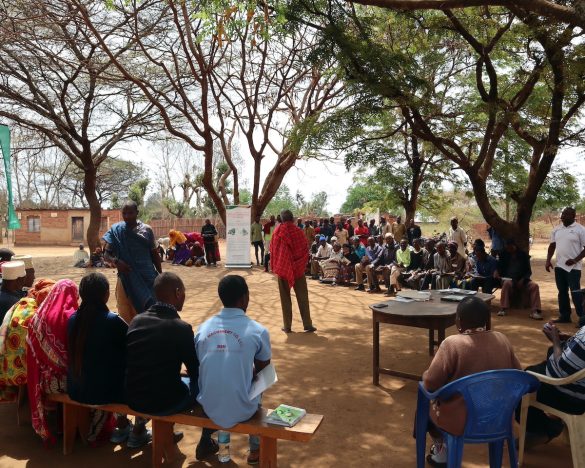
In a recent interview with Radio International Institute of Tropical Agriculture (IITA), Francis Muthoni detailed how the project has been applying GIS tools to help promote the right technologies at the right location to the right people, limiting negative consequences to farmers.
Listen to the interview at the link below.
Radio IITA · Digital Space with Dajie Odok – 23rd August, 2021
Some extracts from the interview

The Africa RISING Program uses GIS tools to limit ‘negative impacts of the tradeoff between productivity and environmental sustainability.’ These tools promote effective and efficient deliverables of sustainable technologies because they enrich decision(s)-making and facilitate the use of the correct options for sustainable intensification.
Because information is power, the details from the GIS tools give technicians the green light toward scalability of technologies, especially in areas with similar levels because these tools provide biophysical, socio-economic conditions, and so much data, which could have a positive /negative influence on the adaption of the integrated agriculture technologies.
What is a Geospatial tool?
It comprises a set of tools that address location issues. For example, everything has a geographical reference. These tools involve all groups of techniques and operators engaged in addressing the questions related to what is found and when.
The earth features can be referenced through the streets within the location or other unique landmarks, but mostly ideally, it is referenced using the global positioning system (GPS). The GPS uses a system of satellites located above the earth’s surface that refer to every place in the world with a unique set of geographical coordinates.
In summary, geospatial tools involve all the techniques and operations that include gathering, analyzing, visualizing information about all the geographical phenomena in the world.
How is it applying to agriculture?
The geospatial tools are becoming one of the most significant components for agriculture because they are mainly applied to support decision-making on important cropping calendar activities such as the information about which crop can be grown where depending on the climate conditions and soil characteristics. These are among the essential questions in agriculture. Among geospatial tools used in agriculture is remote sensing, which involves collecting data through satellites, aerial photos or drones, to observe the phenomena on the earth’s surface, such as the crop types, soil, land cover, and climatic /weather condition.
Geographical information systems are applied in agriculture to prioritize, plan, or guide when to plant, harvest and apply fertilizer. Provision of such highly localized information is referred to as precision agriculture because we can precisely determine what needs to be done on a very localized scale, from a single farm to a single tree or plant. We monitor these conditions through satellites or drones. As the GIS specialists, we generate this information to guide farmers on what crop management practices need to be done given the specific environmental conditions. Such recommendations reduce the risk of failure of agricultural enterprises.
In a nutshell, GIS tools are used for decision support tools in agriculture.
Can individuals access these tools?
We have a list of tools accessible for different people, such as scientists as GIS specialists. We work on deciphering information from the data obtained from the earth-observing satellites. It is difficult for farmers or development workers to directly interpret and generate actionable or relevant insights from satellite data. So, we apply geographical information systems/ analytical methods to generate actionable information from the satellites. For example, satellites provide data on rainfall conditions. Geospatial scientists analyse and map the magnitude of rainfall experienced at a particular place and time. Moreover, the historical observations of rainfall from satellites are applied to forecast future onsets, cessation, or rainfall intensity. By providing such information, we enable farmers or development agents to make evidence-based decisions rather than wild guesses.
What are some of the risks you see when scaling out the technology?
Well, I would respond in two ways, the first is, scaling out the geospatial technologies as far as the technology itself and scaling out the outputs coming from them on how it is helpful to assist in scaling out the agriculture technology, and the second is how the GIS tools scale-out agricultural technology.
The extrapolation suitability index (ESI) utilizes data from agronomic trials and remote sensing and generates maps on the suitability of a particular technology beyond the trial sites.
On the other hand, the impact based spatial targeting index (IBSTI) is another tool that performs the ex-ante estimation of the potential impact of the technology if adopted at scale in the suitable zone. These two spatially explicit indices that support rational decision-making on investment also pickup of technologies since they reduce the risk of failure of technologies. For example, the ESI map developed from the bundle of technologies, including the maize varieties and inorganic fertilizers in Tanzania. This map is guided by questions on yield gaps of suitable ESI-mapped areas vs. the less suitable areas. The data are crucial to multiple levels of stakeholders including the agro-dealers, seed companies involved in producing or distributing improved seeds and fertilizers to target supplies to regions where their technologies have the highest potential societal impact. For example, the seed companies can utilize the ESI and IBSTI maps to target suitable and high-impact zones for disseminating market and advisory services to promote adoption of the particular technology package.
We have also noted the map provides data on sustainable areas for agriculture production. Therefore, if we invest in a suitable zone, then the cost of production will be low since it reduces the requirements for inputs such as fertilizers and water for irrigation.
Is this technology crop-specific, or it works for every crop?
It is very generic and can be adapted to any crop, not only crops, but also bundles of agriculture technologies, because it is based on something; it was grown at a certain place, and the person who did the trials or validation can be able to say the bundle of technologies require certain conditions, rainfall amount, soil (ph, acidic), etc., once people who generated the technology can identify the thresholds where it is working. Because we have spatial data covering the whole world, we can map the list of scaling. In a nutshell, it applies to any technology.
How does it promote food security in Africa?
We promote food security when small-scale farmers adopt the new improved technologies that the IITA is generating. The indexes enhance technology adoption and address the issues of technology failure.
We want to inform the extension and development agency where certain technologies can work better. In that way, we reduce the risk of failure, we also enhance adoption. Once improved technology is adopted in mass or at scale, we will have delivered greater yield, increased income, and institutional capacity.
GIS tools address the main issues of adopting the appropriate technology in a proper environment. If the technology is adopted in sustainable areas, it becomes more suitable (biophysical and social-economic content) and reduces the cost of production and delivery and the environmental impact of the technologies. It improves the efficiency of technology so as they can be adopted en mass.
Who can afford the technology?
Much GIS data is coming out of open sources like in the Africa RISING program, and many applications in CGIAR are using open-source geospatial data. However, use of this data is a specialized skill requiring significant training and capacity building, especially in Africa. There are costs involved in the training and acquisition of commercial satellite data. Open-source data are becoming more available, especially those provided by NASA and the Copernicus Program of the European Space Agency.
Are the tools suitable?
Yes, regarding the impact they are supposed to bring into agriculture, and when I look at the development that is going on, as I mentioned, there is an increasing number of investments and platforms for collecting environmental data, other observations data is realized on open source in a prominent institute like NASA and state agents. There are also many investments in improving the analytical work in that context. The future looks very bright on the development and applicability of these tools because most development programs apply geospatial tools to guide decision-making within their area of domain.